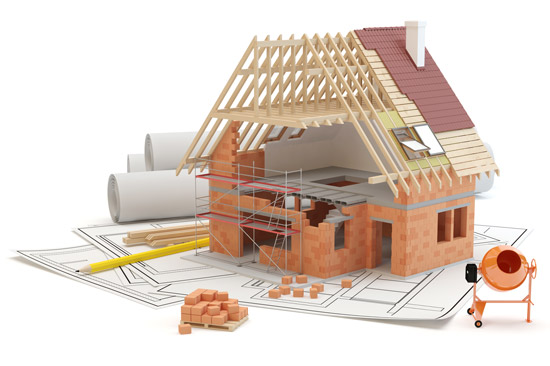
New Construction made up 35% of the market during the 3rd QTR for 2019 in Clemmons, North Carolina.

Market Report for Clemmons
At the end of October 2019, there are 161 listings marked pending in the multiple listing service. This number includes single-family properties and townhomes. The available inventory for single-family homes is 206 listings and 14 townhome listings. The average sales price is $285,096 for a single-family homes and the average sales price is $226,367 for a townhome property.
Analysis of the aborption rate indicates an inventory of 4 months for single-family homes and a 2 months inventory for townhouse properties.
Pending Listings end of October 2019
Pendings include single-family properties and townhomes.
Shop Clemmons, NC Homes under 300K
Median Sales Price & Average Sales Price thru 2019
| Month | Sale Price, Median | Sale Price, Average |
|---|---|---|
| Jan | $216,500 | $241,132 |
| Feb | $233,500 | $246,757 |
| Mar | $283,650 | $289,057 |
| Apr | $314,892 | $300,772 |
| May | $268,000 | $293,828 |
| Jun | $292,777 | $290,596 |
| Jul | $280,815 | $296,440 |
| Aug | $277,500 | $289,648 |
| Sep | $255,000 | $285,968 |
| Oct | $277,000 | $282,220 |
Time frame is from Jan 2019 to Oct 2019
Closed Homes in Clemmons
During the 3rd QTR, there were 158 residential closings. This number included single family listings and townhomes. The most active price point was in the $150,000 to $299,999 range which made up 56% of closed sales at 90 homes. The second most active price point of closed listings was in the $300,000 to $499,999 range were 49 homes closed.
Charts on Clemmons Market Statistics
New Construction under 400K
Request More Information

