Enjoy this Clemmons & Lewisville Market Report for the 2nd Quarter 2021.

- Market Report for Clemmons & Lewisville
- Newest Clemmons Listings
- Available Inventory & Months Supply of Homes
- New Construction in Clemmons
- Closed Homes in Clemmons & Lewisville
- 2nd QTR 2021 Clemmons & Lewisville
- Days on Market & Percent of List Price
- 2nd QTR 2021 Clemmons & Lewisville
- Map of Clemmons
- Map of Lewisville, NC
- Request More Information
Market Report for Clemmons & Lewisville
2nd QTR 2021 Clemmons & Lewisville
Single-Family Homes
 At the end of 2nd QTR 2021 for Clemmons & Lewisville, there are 272 Single-Family Homes marked pending. The available inventory for Single-Family Homes is 76 listings.
The Average Sales Price is $367,507 for a Single-Family Home. This is an increase of +11% from the 2nd QTR in 2020 when the Average Sales Price was $331,068.
In the 2nd QTR 2021, the Median Sales Price is $339,500 for a Single-Family Home. This is an increase of +11.5% from the 2nd QTR 2020 when the Median Sales Price was $304,455.
Analysis of the absorption rate for the Clemmons & Lewisville Market indicates an inventory of 0.9 month for Single-Family Homes.
Newest Clemmons Listings
Available Inventory & Months Supply of Homes
2nd QTR 2021 Clemmons & Lewisville Market
2nd QTR 2021 Clemmons & Lewisville Market
New Construction in Clemmons
Closed Homes in Clemmons & Lewisville
 In the 2nd QTR 2021 for the Clemmons & Lewisville, a total of 252 Single-Family homes closed in the Clemmons and the Lewisville areas. This is an increase of +15.6% from the 2nd QTR in 2020 when 218 listings closed.
Of the closed properties in the 2nd QTR 2021, 79% of the listings were under contract in the first 30 days on the market.
The most active price ranges were homes in the $300,00 to $399,999 range and in the $200,000 to $299,999 range. Combined both price ranges made up 64% of the closed properties in the 2nd QTR 2021.
You might also like:
1st QTR 2020 Clemmons/Lewisville Market Report
2nd QTR 2020 Clemmons/Lewisville Market Report
3rd QTR 2020 Clemmons/Lewisville Market Report
4th QTR 2020 Clemmons/Lewisville Market Report
2nd QTR 2021 Clemmons & Lewisville
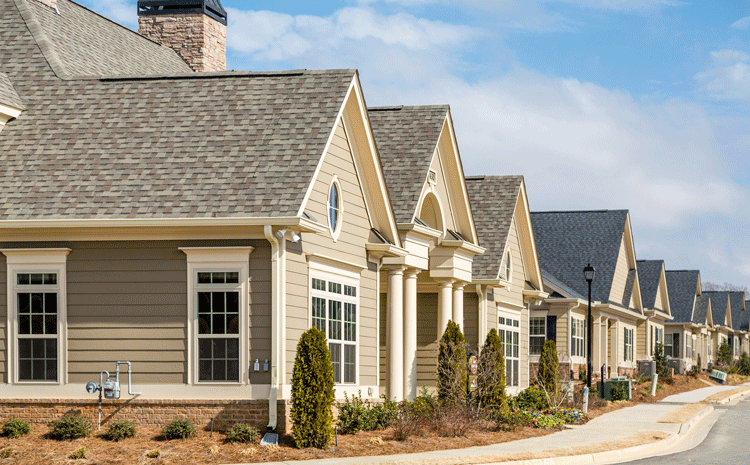
Townhome Listings
 At the end of the 2nd QTR 2021, 17 Townhome Listings were marked pending in the Clemmons & Lewisville Market. There are 3 townhome listings available for sale.
The Average Sales Price is $268,455 for a Townhome. This is an increase of +32.9% from the 2nd QTR 2020 when the Average Sales Price was $202,010.
The Median Sales Price is $197,500 for a Townhome in the 2nd QTR 2021. This is a decrease of -7.7% from the 2nd QTR 2020 when it was $213,945 for a townhome property.
During the 2nd QTR 2021, 24 Townhome listings closed which is a decrease of -4.0% from the 2nd QTR 2020 when 25 Townhome properties closed.
Analysis of the absorption rate for the Clemmons & Lewisville Market indicate 0.5 month inventory for Townhome properties.
Days on Market & Percent of List Price
Clemmons & Lewisville Market
Clemmons & Lewisville Market
2nd QTR 2021 Clemmons & Lewisville
Summary
New Listings increased by +21.5% in the 2nd QTR 2021 in the Clemmons & Lewisville Real Estate Market from the previous year. Pending Sales increased by +12.4%. Closed Sales showed an increase of +15.6% from the 2nd QTR in 2020. Prices are still rising because of the inventory shortage.
The Median Sales Price for Single-Family Home was $ 339,500, which is an increase of +11.5% from the 2nd QTR in 2020. The Average Sales Price was $367,507 at the end of the 2nd QTR 2021. This was an increase of +11% from the 2nd QTR in 2020.
Sellers are receiving 101.5% of their list price. Inventory levels for single-family homes decreased by -49.7% and townhomes by -57.1%. At the end of June 2021, 76 single-family homes and 3 townhomes were available for sale. Homebuyers in 2021 will continue to be challenged by the low inventory levels.
Request More Information


